
Food & personal-care scanner
A grade for your body — not everyone’s.
She wasn’t average. Neither are you.


Free to start — 7 days or 25 scans, no card. Barcode scans stay free after. Built for 140+ conditions and protocols.
How it works
-
1 · Tell it what applies
- High blood pressure
- IBS
- Celiac
- Type 2 diabetes
- On a GLP-1
- Perimenopause
- Low-FODMAP
- + 130 more
Conditions, diets and goals. Each person in the house gets their own profile. See all 140 →
-
2 · Scan the label
CameraWhole label in one shot BarcodeFastest for known brands TypePaste from a recipeAbout five seconds, in the aisle or at home.
-
3 · Get a grade for you
- AGo for it.85–100
- BLooks pretty good.70–84
- CSure, occasionally.55–69
- DMaybe skip this one.35–54
- FNot for you.0–34
With the ingredients that made the difference for you.
- A
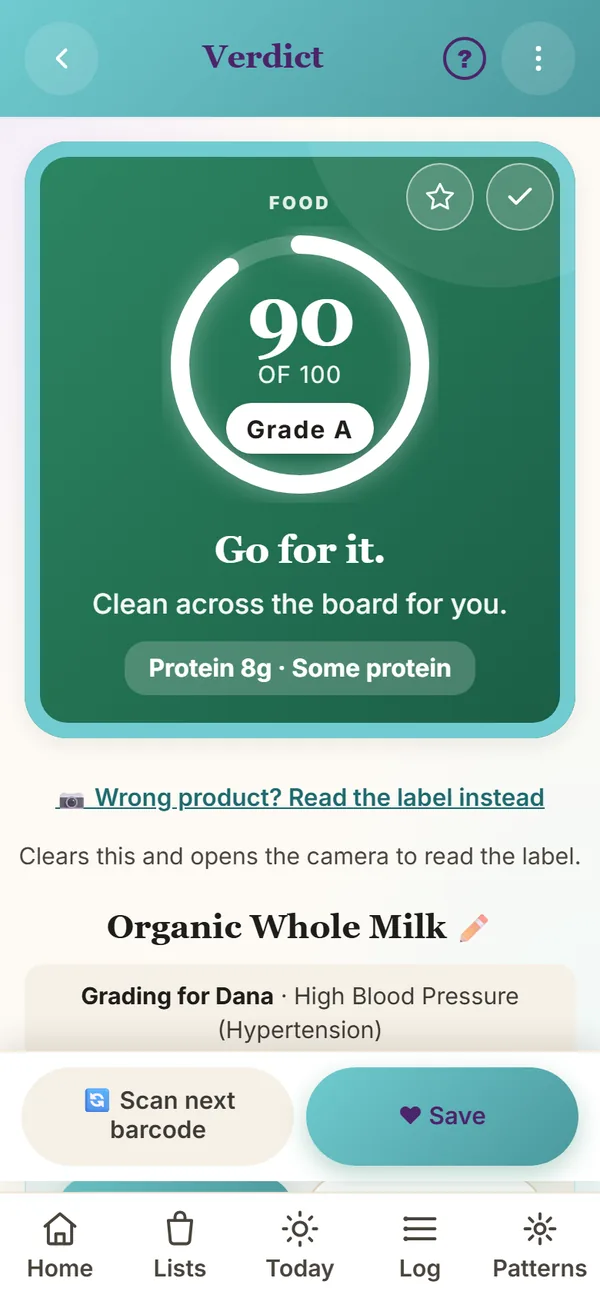
One product. Two bodies. Two grades.
The same carton of organic whole milk, scanned on one phone for two people in the same house.
High blood pressure “Clean across the board for you.”
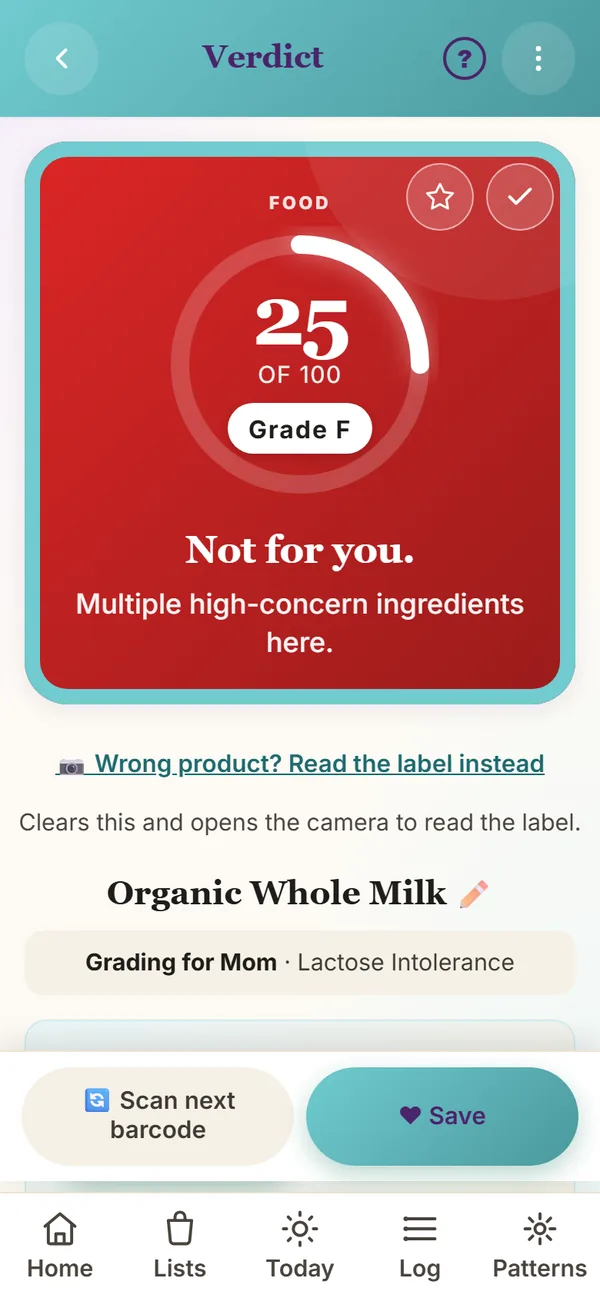
Lactose intolerance Milk is flagged for lactose intolerance.
A general “health score” gives everyone the same answer. Velrae Method checks each ingredient against what applies to the person it’s grading for — up to 6 profiles on one phone.
After the scan, it keeps your journal
Real screens from four weeks of a sample journal: Dana, who has high blood pressure and IBS.
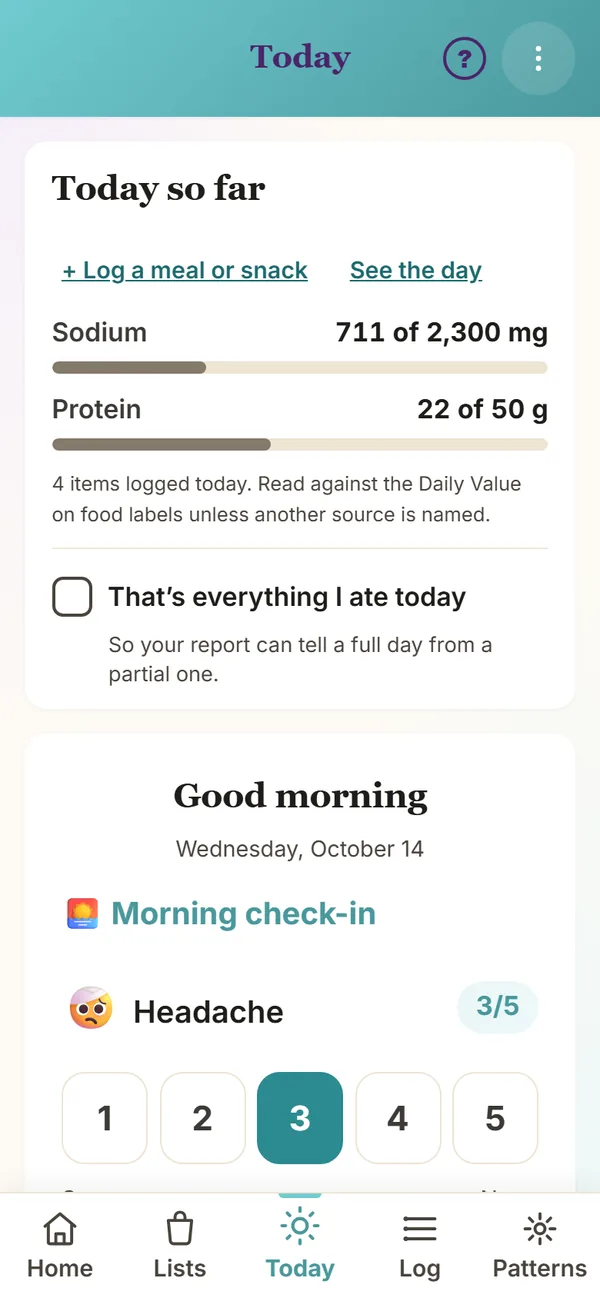
How do you feel today?
Tap 1 to 5 for each row — about seven seconds. The rows follow what applies to you: Gut and Bloating for IBS, Hot flashes for perimenopause.
Above it, today so far: what you’ve logged, added up against the label Daily Value.
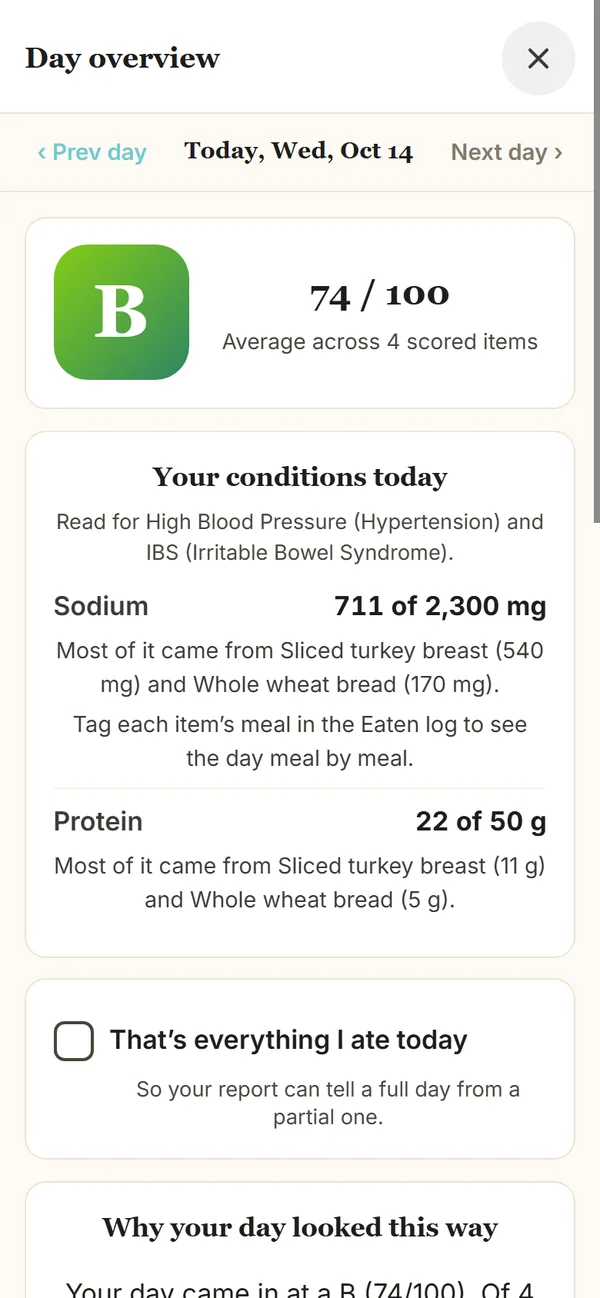
Your whole day, in one grade
Tap any day in the Log. The day gets its own grade, and each number is added up against a target — with the foods most of it came from.
- B74 / 100 across 4 items
- 711 mgsodium, of 2,300 — mostly the sliced turkey
- 22 gprotein, of 50
The Log shows every day with its grade, so a run of C’s stands out at a glance.
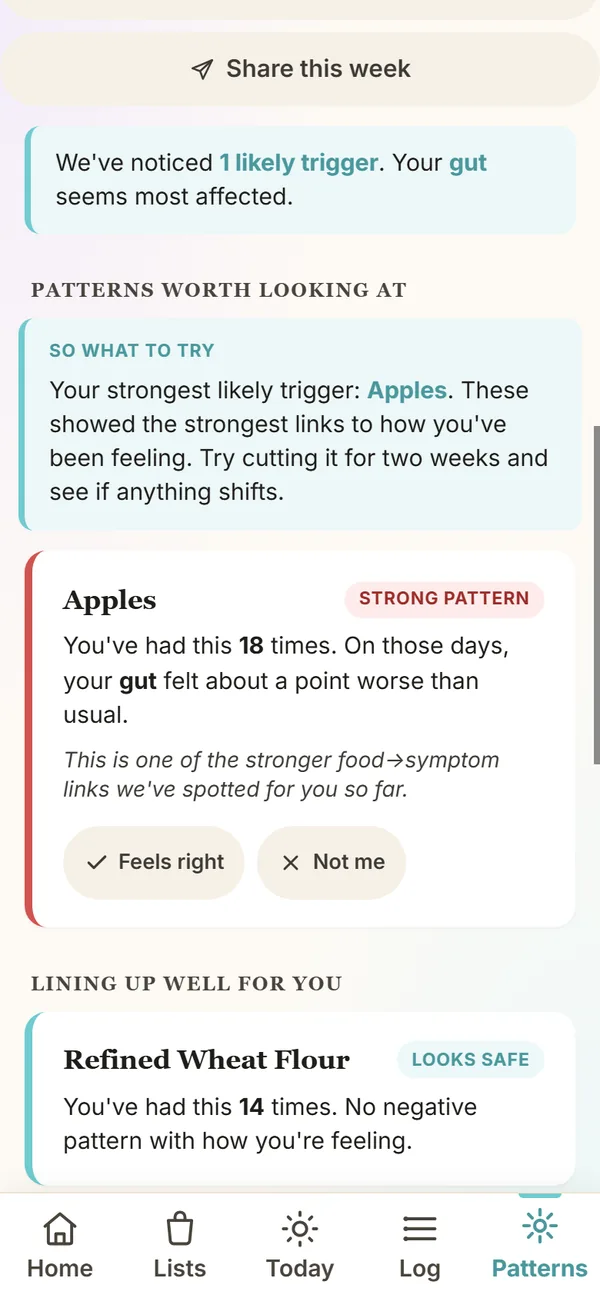
What lines up, from your own days
After a couple of weeks of check-ins, Patterns compares the days you felt off with what you ate before them. In this sample, apples came up 18 times, and gut scores were about a point lower on those days.
You decide what it means: Feels right or Not me.
Worked out on your phone, from your entries. Never sold, sent or shared.
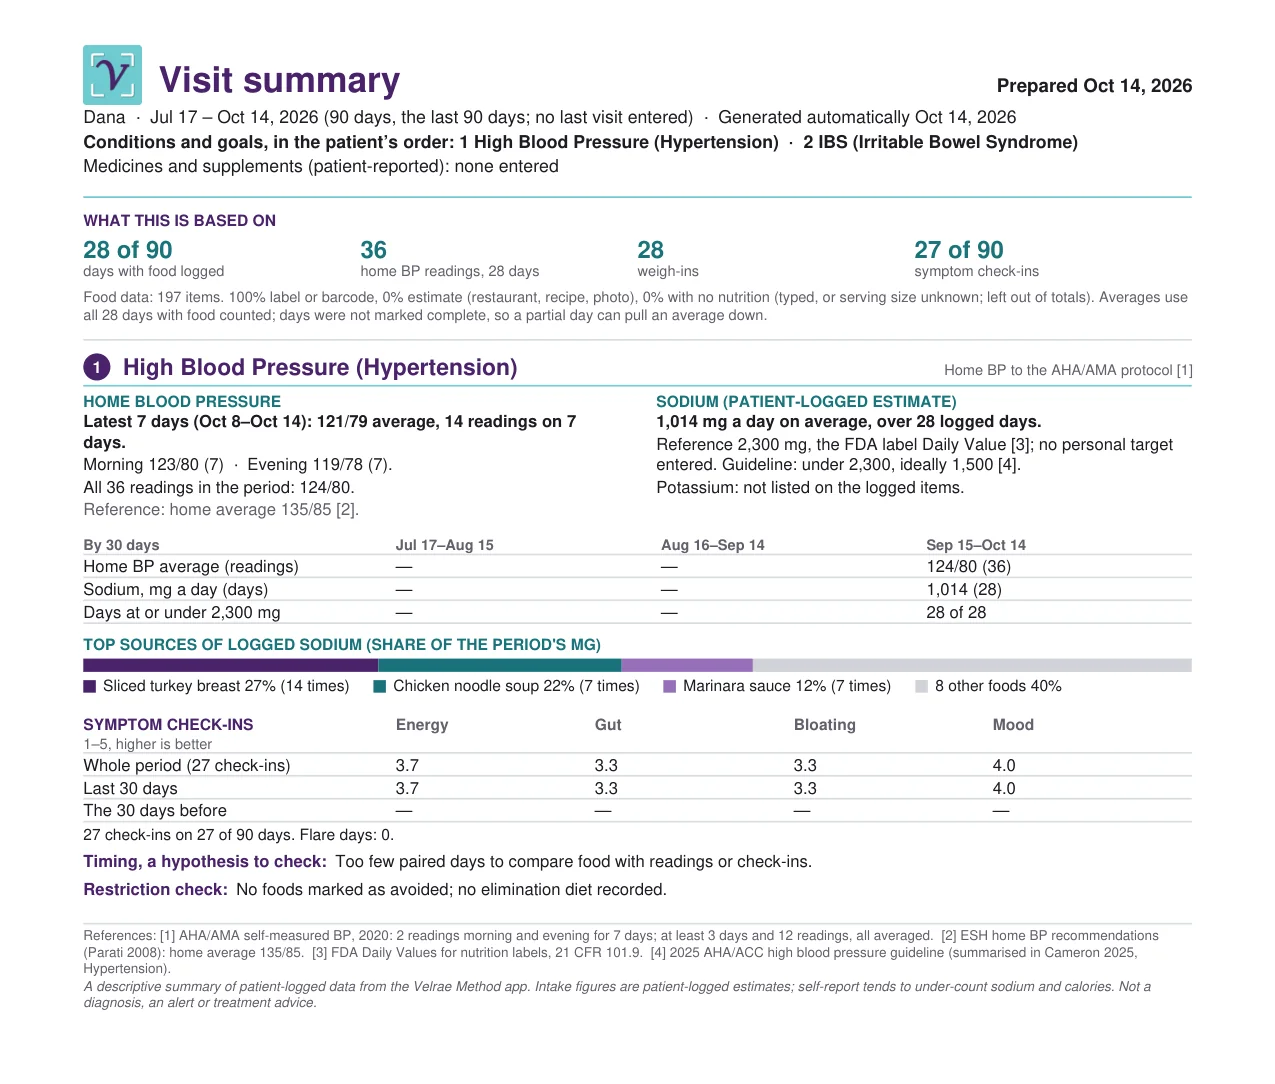
A visit summary to hand across the desk
Before an appointment, make a summary of everything since your last visit: your home blood pressure averages, what you logged, your check-ins, and the foods behind the numbers. Every target names its source.
Plus Your month, a page just for you. More about the visit summary →
One price. Yours.
$29.99/year or $59.99 lifetime — try everything free for 7 days or 25 scans first, no card.
Is this right for your body?
Find out on your own labels.
Want to try it before installing? The live demo is on the Features page.